Average TikTok Engagement Rate 2026: 2.01% by Followers
Quick answer
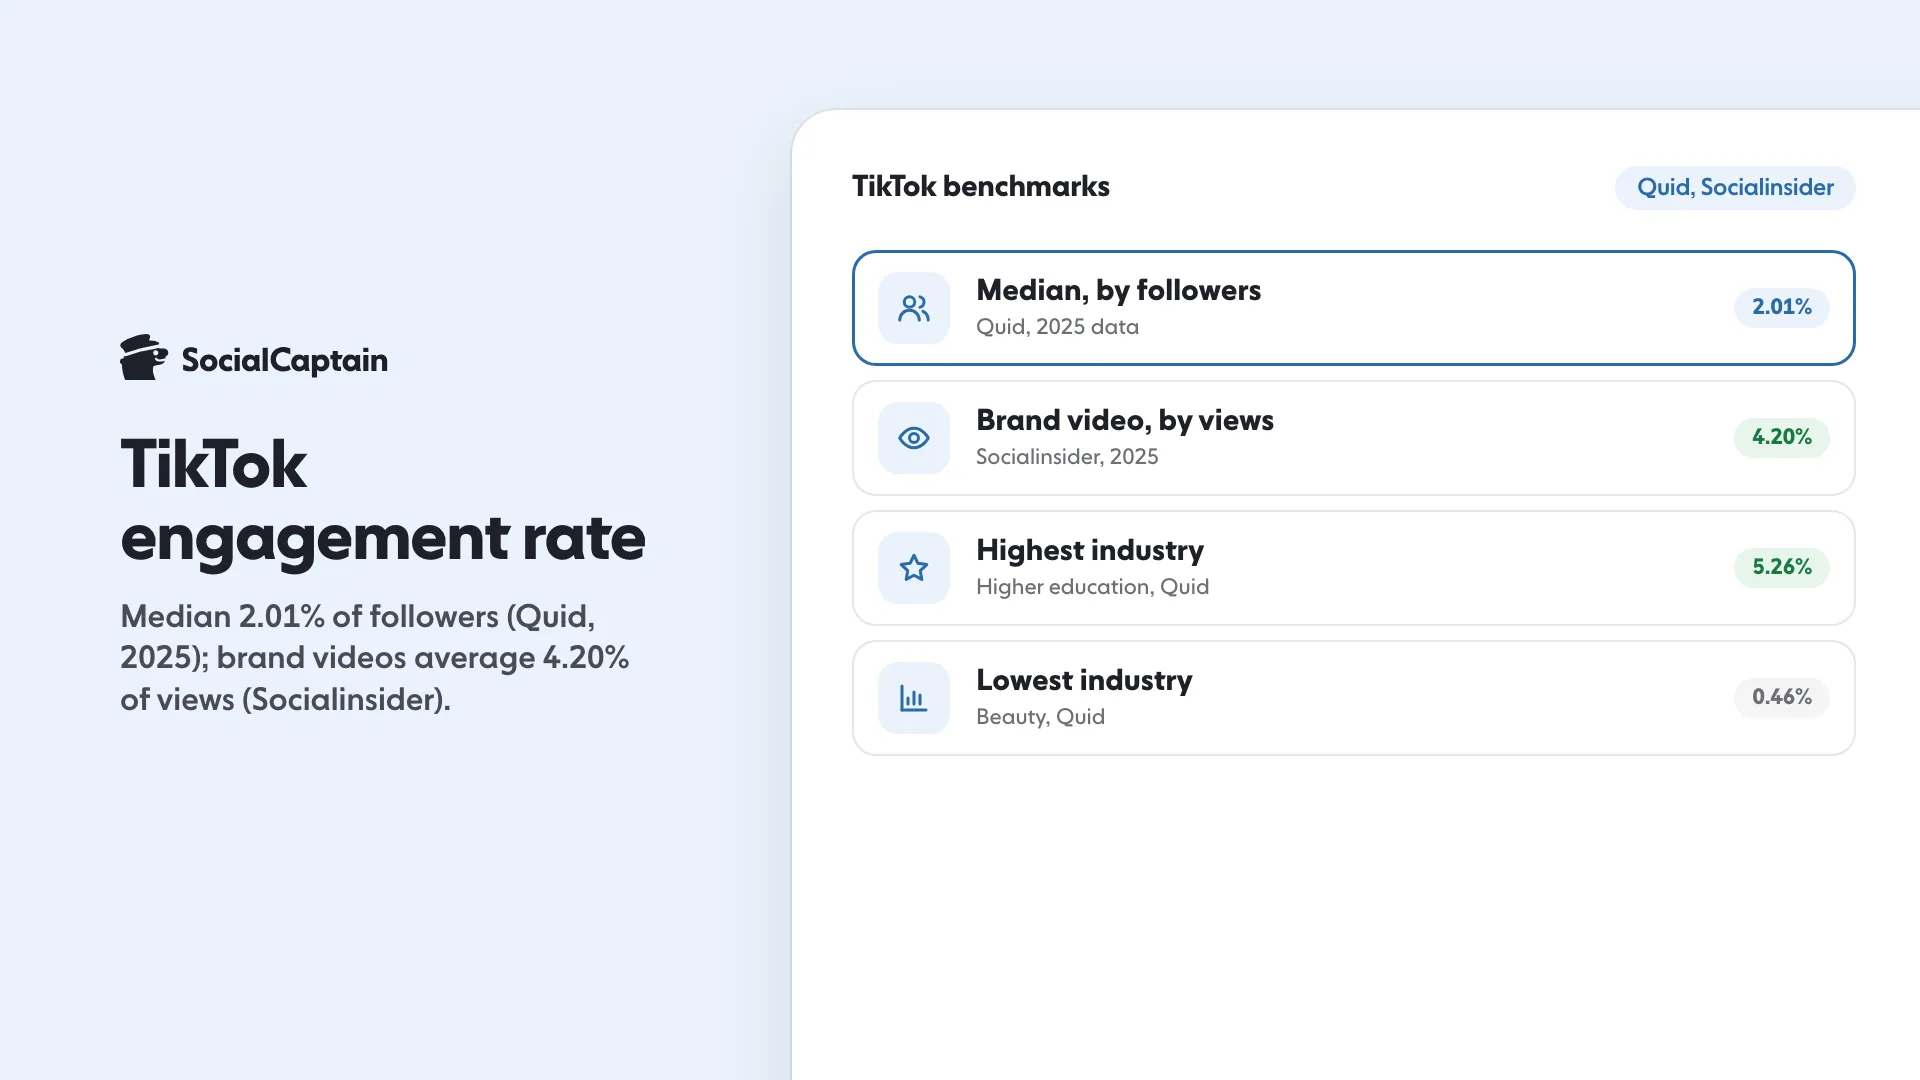
The median TikTok engagement rate is 2.01% of followers across 18 industries (Quid, 2026 report, 2025 data). Socialinsider's average brand video earned 4.20% of its views in 2025, up from 3.85% in 2024. By industry the median runs from 0.46% for beauty to 5.26% for higher education.
2.01%median TikTok engagement rate by followers (Quid, 2025 data)
- By followers, the median company earns 2.01% (Quid, 2025 data).
- By views, brand videos averaged 4.20% in 2025 (Socialinsider).
- By industry: 0.46% for beauty up to 5.26% for higher education.
Fact-checked Nov 16, 2026
On this page12 sections
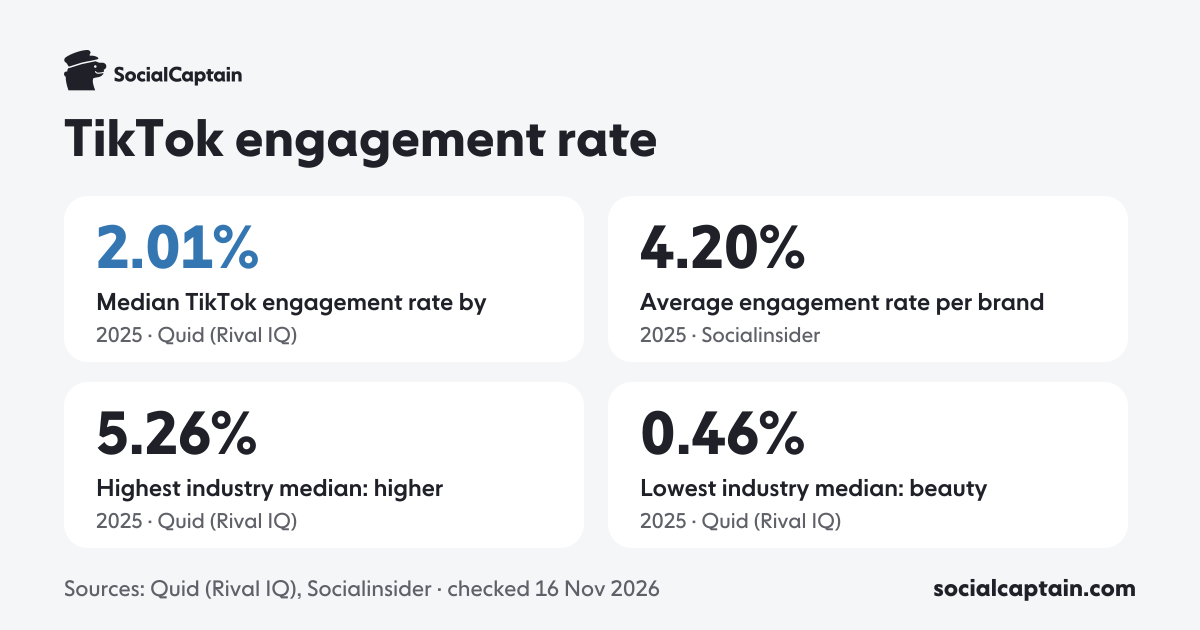
The average TikTok engagement rate in 2026 reports is 2.01% of followers: that is the median company across 18 industries in Quid’s 2026 benchmark report (the former Rival IQ report, which measures 2025). Socialinsider, which divides by views instead, finds brand videos averaged 4.20% in 2025, up from 3.85% in 2024. By industry the median runs from 0.46% for beauty to 5.26% for higher education. We read every source on its publisher’s own page on 16 November 2026.
2.01%
Median TikTok engagement rate by followers, all 18 industries
4.20%
Average engagement rate per brand video, by views
5.26%
Highest industry median: higher education
0.46%
Lowest industry median: beauty
What is the average TikTok engagement rate?
There is no single number, because studies divide by different audiences. These are the three large studies, each read on its publisher’s page, with the measure named.
| Study | Measure | Average or median | 2024 | 2025 |
|---|---|---|---|---|
| Quid (Rival IQ) | Interactions divided by followers | Median company | 1.73% | 2.01% |
| Socialinsider | Interactions divided by views | Average brand video | 3.85% | 4.20% |
| Buffer | Engagements divided by reach | Median post | About 4.4% | About 4.5% |
The rates cannot be averaged or ranked against each other, because each divides by a different audience. Pick the row that matches how you measure your own account. Buffer’s page gives the 2025 median as about 4.5% in its text and about 4.6% in its tier list; we print the text. Buffer’s median for video posts was 3.39% and for images 1.92%; both sit below its 4.5% overall figure, and the report does not explain the gap.
What is the average TikTok engagement rate by followers?
Quid’s median company earned 2.01% of followers in 2025, the highest of any platform in its report. Quid defines the rate as total interactions divided by follower count, with interactions including likes, comments, favorites, reposts and shares. Its TikTok history shows how far the rate has fallen from its first years, with a small rebound last year.

Source: Quid (Rival IQ). Table below.
| Year | Median engagement rate by followers |
|---|---|
| 2022 | 5.69% |
| 2023 | 2.63% |
| 2024 | 1.73% |
| 2025 | 2.01% |
Quid’s chart has four years of TikTok data, and 2025 is above 2024. Quid’s sample is 150 companies picked at random in each of 18 industries from a database of more than 200,000, mixing organic and paid posts. Quid’s page gives no breakdown by follower count, so the by-followers rate has no follower-tier table here.
Does the TikTok engagement rate change with follower count?
Yes, a little, and only when the rate is divided by views. Socialinsider’s TikTok benchmark covers 40,694,424 brand videos from 257,000 accounts with 1,000 to 1 million followers (organic posts only), and its average rate by views is highest for the smallest brands and lowest in the middle.
| Followers | 2024 | 2025 |
|---|---|---|
| 1,000 to 5,000 | 4.20% | 4.40% |
| 5,000 to 10,000 | 3.85% | 4.00% |
| 10,000 to 50,000 | 3.80% | 3.90% |
| 50,000 to 100,000 | 3.75% | 3.75% |
| 100,000 to 1 million | 3.95% | 3.95% |
Socialinsider’s page does not reconcile its headline with its tiers: four of the five 2025 tier rates are below the 4.20% headline, and it does not say how the headline is weighted. Its methodology also says accounts above 100,000 followers were left out, which its own 100,000 to 1 million row contradicts. We print the table and the headline as published.
What did Socialinsider’s 2026 video study find by follower tier?
Socialinsider’s separate video study covers 8,021,416 TikTok videos from January to June 2026, with views per video in each tier. Its rate is higher in every tier, and it too is highest for the smallest accounts, while average views rise from 317 to 22,700.
| Followers | Average engagement rate by views, Jan to Jun 2026 | Average views per video |
|---|---|---|
| 1,000 to 5,000 | 5.25% | 317 |
| 5,000 to 10,000 | 4.70% | 855 |
| 10,000 to 50,000 | 4.50% | 2,500 |
| 50,000 to 100,000 | 4.40% | 7,500 |
| 100,000 to 1 million | 4.50% | 22,700 |
The two Socialinsider pages use slightly different formulas (the benchmark counts likes, comments, shares and saves; the video study’s formula lists likes, comments and shares), so the two tables are not one series. Both put the highest rate at the smallest tier and the lowest at 50,000 to 100,000. Neither covers accounts under 1,000 or over 1 million followers.
What is the average TikTok engagement rate by industry?
These are the median engagement rates by followers for 18 industries in Quid’s 2026 report, which measures 2025. Quid’s page prints the figures in a chart, not in text, so we copied each value printed on the chart image on Quid’s own page.

Source: Quid (Rival IQ). Table below.
| Industry | Median engagement rate (by followers) |
|---|---|
| Higher education | 5.26% |
| Pharma and healthcare | 4.63% |
| Alcohol | 4.62% |
| Energy sector | 3.97% |
| Aviation | 3.02% |
| Media | 3.02% |
| Sports | 2.64% |
| Nonprofits | 2.58% |
| Financial services | 2.08% |
| Hotels and resorts | 1.94% |
| Food | 1.41% |
| Automotive | 1.37% |
| Pet brands | 1.14% |
| Fashion | 1.13% |
| Influencers | 0.83% |
| Retail | 0.81% |
| Tech | 0.81% |
| Beauty | 0.46% |
Quid’s median across all 18 industries is 2.01%. Nine industries sit above it and nine below. Quid’s own text names Pharma, Higher Education, Alcohol and Energy as the standouts, and lists Fashion and Influencers below the all-industry median. The report has no industry-by-follower-tier table, and no TikTok industry figure from Socialinsider’s page, so a rate for a small account in one industry is not published in either source.
What is a good engagement rate on TikTok?
A good rate is one that beats the median for your industry on the same formula. By followers, 2.01% is the median company across the 18 industries in Quid’s report, but the industry medians in the table run from 0.46% to 5.26%, so a beauty brand at 1% is ahead of its field and a higher-education account at 3% is behind its own. By views, Socialinsider’s brand average was 4.20% in 2025, and its smallest tier averaged 4.40%.
Two cautions come from the sources. Quid and Socialinsider cover company and brand accounts, so a personal creator account is a different comparison. And the rates are per-video averages that include breakout hits, so one viral video can lift an account’s average while most of its videos sit below it; Buffer says it uses medians because a few viral posts skew averages. For the timing side, see when to post on TikTok.
How do you calculate TikTok engagement rate?
Add the interactions on a video and divide by an audience number, then multiply by 100. The studies differ on which audience number they use and which interactions they count.
| Source | Interactions counted | Divided by |
|---|---|---|
| Quid (Rival IQ) | Likes, comments, favorites, reposts, shares | Followers |
| Socialinsider (benchmark) | Likes, comments, shares, saves | Views |
| Socialinsider (video study) | Likes, comments, shares | Views |
| Buffer | Not listed for TikTok (“engagements”) | Reach (views where reach is unavailable) |
To work out your own rate, take a video’s likes, comments, shares and saves from TikTok’s analytics, divide by that video’s views for a by-views rate or by your follower count for a by-followers rate, and compare it only with a benchmark using the same divisor. TikTok analytics shows where to find each number.
Why do TikTok engagement benchmarks differ?
- Divisor: followers, views and reach give three different rates for the same video. A video seen by many more people than follow the account has a lower rate by followers than by views.
- Average or median: Socialinsider reports averages; Quid and Buffer report medians. Averages are pulled up by viral videos.
- Who is counted: Quid samples 150 companies per industry; Socialinsider covers brand accounts with 1,000 to 1 million followers; Buffer covers accounts that publish through its tool.
- Paid posts: Quid’s sample mixes organic and paid posts. Socialinsider’s TikTok benchmark is organic only.
- Labelled year: Quid’s “2026” report measures 2025 (its chart ends at 2025). Socialinsider’s TikTok page says it “contains 2025 values, presented as 2026”.
What is not published?
- No first-party figure. TikTok does not publish an average engagement rate, so every figure here comes from an analytics or social media tools company.
- No Quid TikTok table in text. The industry figures are read from a chart image on Quid’s page, not from printed numbers.
- No industry split from Socialinsider on its TikTok page, and no follower-tier split from Quid.
- No 2026 full-year figure. Socialinsider’s page also carries first-half and third-quarter 2026 averages, but its stated period runs past its publication date, so we do not print them.
- No rate for accounts under 1,000 or over 1 million followers in the sources we read in full.
What these numbers mean for your account
Compare your own rate with the row that matches your formula and your industry, not with one headline number. If you divide by followers, 2.01% is the median company and your industry’s row in the table is the fairer bar; if you divide by views, brand videos averaged 4.20% in 2025. By views, the smallest accounts earn the highest rate: the smallest tier averaged 4.40% in 2025 and 5.25% in the first half of 2026.
More TikTok figures are on the TikTok statistics page, and when to post on TikTok and how the TikTok algorithm works cover what lifts a video’s reach. To see what a TikTok audience could be worth, use the free TikTok money calculator, and for real, niche-matched followers see the TikTok followers and TikTok likes pages or the TikTok growth service. If you also post on Instagram, none of the rates above apply to it; its separate engagement ideas are in How to Get More Likes on Instagram: 9 Changes That Work.
How we got these numbers
| Study | Sample | Period | Counts |
|---|---|---|---|
| Quid (Rival IQ)2026 Social Media Industry Benchmark Report, 5 Mar 2026 | 150 companies chosen at random in each of 18 industries from a database of more than 200,000 companies; organic and paid posts mixed; medians | Data through 2025 (the chart's last year is 2025; no date range stated) | Median engagement rate per video by followers (total interactions divided by follower count), overall, by industry and 2022 to 2025 |
| Socialinsider2026 TikTok Benchmarks, 22 Apr 2026 | 40,694,424 organic TikTok videos from 257,000 brand accounts with 1,000 to 1 million followers | Yearly averages for 2024 and 2025; the page's own period line runs to December 2026 and its note says it contains 2025 values presented as 2026, so the values are shown as the 2025 values | Average engagement rate by views (likes, comments, shares and saves divided by views), by follower tier |
| SocialinsiderSocial Media Video Statistics 2026, 21 Aug 2026 | 8,021,416 organic TikTok videos from brand accounts with 1,000 to 1 million followers (about 145,500 accounts across five tiers) | January to June 2026 | Average engagement rate by views (likes, comments and shares divided by views) and average views, by follower tier |
| BufferThe State of Social Media Engagement in 2026, 5 Mar 2026 | Tens of millions of posts across 10 platforms (52M+ in the headline); no TikTok-only count; accounts needed 10+ posts in the past year across 4+ weeks | 2025 compared with 2024, data through 3 December 2025 | Median engagement rate as engagements divided by reach, TikTok overall and by format |
Each study read on its publisher's own page on 16 November 2026. We re-check every figure at least every 120 days.
- Quid reports the median engagement rate per video by followers (total interactions divided by follower count) for 150 randomly chosen companies in each of 18 industries; its page prints the industry values only in a chart image, so each value was read from the chart, and the 18 values have a median of 2.01%, matching the report's stated median.
- Socialinsider reports averages of interactions divided by views for organic brand videos from accounts with 1,000 to 1 million followers. Its two pages use slightly different interaction counts, and its TikTok page says it contains 2025 values presented as 2026, so its tables are shown as published and never merged.
- Socialinsider's TikTok page prints a 4.20% headline average beside tier rates of which four of five are lower, and does not say how the headline is weighted; both are printed as published.
- Buffer reports a median engagement rate as engagements divided by reach; its page gives the 2025 median as about 4.5% in text and about 4.6% in a list, and the text value is printed.
- Rates by followers, by views and by reach are different measures; each table names its divisor and no table compares or averages them.
- Every printed figure is the source's own; we add no totals, ratios or averages.
Data as CSVData as JSONInfographic
Cite this page
SocialCaptain (2026). Average TikTok engagement rate 2026. Data checked 16 November 2026. https://socialcaptain.com/blog/average-tiktok-engagement-rate/
FAQ
What is the average TikTok engagement rate?
It depends on the formula. Quid’s 2026 benchmark report, using 2025 data, puts the median company at 2.01% of followers. Socialinsider’s average brand video earned 4.20% of its views in 2025, up from 3.85% in 2024. Buffer’s median post earned about 4.5% of its reach in 2025.
What is a good engagement rate on TikTok?
By followers, above 2.01% beats the median company in Quid’s 2026 report, but the right bar depends on your industry: the medians run from 0.46% for beauty to 5.26% for higher education. By views, Socialinsider’s brand average was 4.20% in 2025.
Does TikTok engagement rate fall as an account grows?
Slightly, by views. Socialinsider’s average fell from 4.40% for brands with 1,000 to 5,000 followers to 3.75% at 50,000 to 100,000 in 2025, then rose to 3.95% at 100,000 to 1 million. Its January to June 2026 video study shows the same shape, from 5.25% down to 4.40%.
Which industries have the highest TikTok engagement rate?
In Quid’s 2026 report (2025 data, by followers) higher education leads at 5.26%, then pharma and healthcare at 4.63%, alcohol at 4.62% and the energy sector at 3.97%. Beauty is lowest at 0.46%; tech and retail are next at 0.81% each.
How do you calculate TikTok engagement rate?
Add the interactions on a video (likes, comments, shares and usually saves) and divide by one audience number, times 100. Quid divides by followers; Socialinsider divides by views; Buffer divides by reach. The three give different rates for the same video, so compare only like with like.
Related guides
Algorithm and reach
TikTok Algorithm 2026: 5 Signals and What Each Rewards
Written by Jonas Revel
Research editor
Jonas Revel runs research on the SocialCaptain blog: the statistics pages, account safety, and the fact-check every article gets before it goes live. Each number is traced to its original source and dated, and figures that cannot be traced are left out.
All articles by Jonas Revel


